")

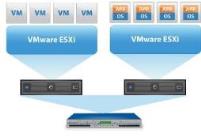
From now monitor VMware is easier thanks to the adoption of a control designed to work in depth on ESX (i), vSphere, vCenter and VirtualCenter.
This control is able to deeply monitor the Host Server and all the virtual machines running on it.
The control thanks to VMware API is able to provide the following parameters:
|
NAME |
APPLICATION |
|
|
HOST (ESXi5.0) |
Connectivity |
Check if connection is up |
|
Cpu_usage |
Cpu usage percentage |
|
|
Mem_Usage |
RAM usage percentage |
|
|
Swap |
Swap memory usage in MB |
|
|
Mem_Overhead |
Return RAM overhead due to virtualization |
|
|
Mem_Overall |
VMware Server memory usage in MB |
|
|
VM_Mem_Ctl |
Vmmemctl memory usage |
|
|
Network_usage |
Network throughput usage |
|
|
Net_received |
Incoming Network throughput usage in KBs |
|
|
Net_sent |
Outcoming Network throughput usage in KBs |
|
|
NICs |
Check for network card connection |
|
|
Aborted_commands |
Sum of aborted commands |
|
|
IO_bus_resets |
Disk bus resets |
|
|
Read_latency |
Read Disk latency in ms |
|
|
Write_latency |
Write Disk latency in ms |
|
|
Queue_latency |
Processes I/O latency in ms |
|
|
Connection_state |
Runtime connection state |
|
|
Runtime_health |
Host overall health |
|
|
Temperature |
Internal Temperature |
|
|
Issues |
Hosts issues |
|
|
Overall_status |
Overall objects status |
|
|
Host_maintenance |
Check if host is in maintenance state |
|
|
Machine_status |
Check VM states (Up/down) |
|
|
Uptime |
Host Uptime |
|
|
VIRTUAL MACHINE |
Cpu_usage |
Cpu percentage usage |
|
Cpu_wait_time |
Cpu mean wait time |
|
|
Mem_Usage |
Memory usage |
|
|
Swap |
Swap memory usage |
|
|
Active_mem |
Active memory usage |
|
|
Network_usage |
Overall network throughput |
|
|
Net_received |
Incoming network throughput |
|
|
Net_sent |
Outcoming network throughput |
|
|
IO_usage |
IO usage in MB |
|
|
Read_latency |
Disk read latency |
|
|
Write_latency |
Disk write latency |
|
|
Connection_state |
Connection state at runtime |
|
|
Runtime_cpu |
Run time cpu in Mhz |
|
|
Runtime_mem |
Run time memory usage |
|
|
VM_state |
VM state |
|
|
Tools |
Check VmWare tools state |
|
|
Issues |
VM issues |